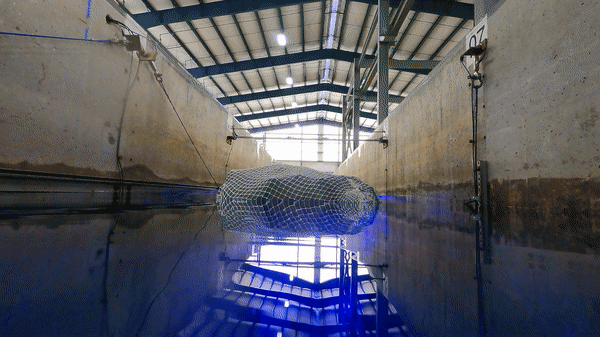
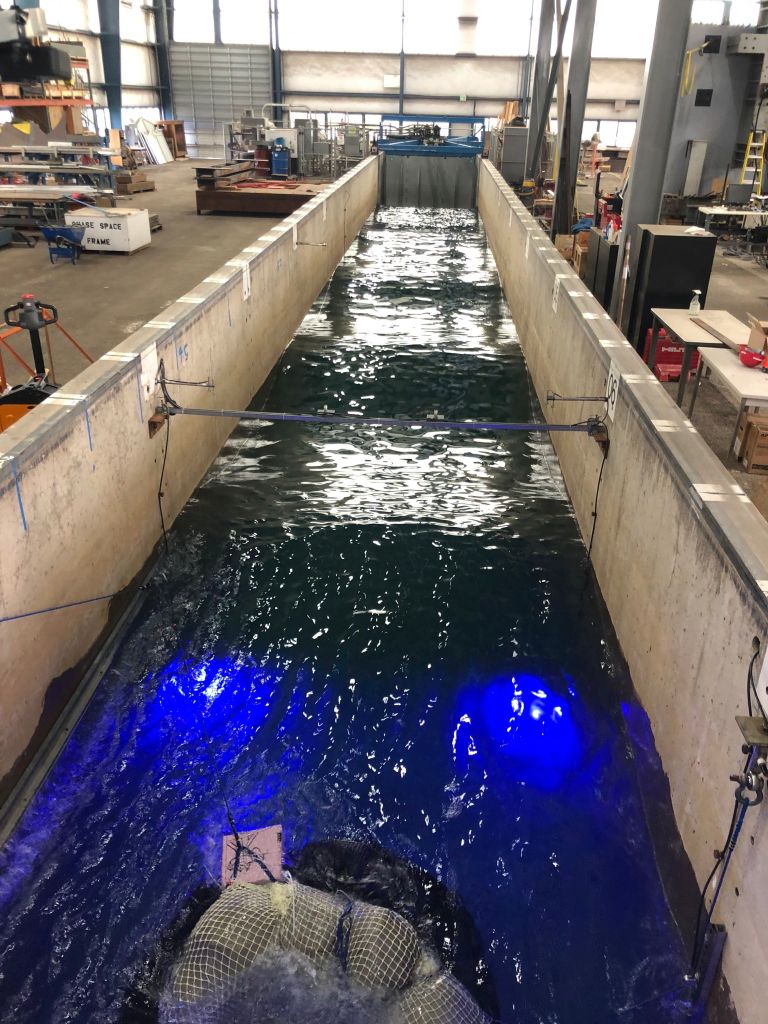
We returned to the O.H. Hinsdale Wave Research Facility at Oregon State University in the Summer of 2022 to pursue additional wave tank experiments. During this visit, we used the linear wave flume, a long skinny tank (342 foot long, 12 foot wide, 9 foot deep) that produces controlled waves that move uniformly along the long axis.
The goal was to look more closely at the micro-scale hydrodynamic effects in the immediate surroundings of a single full-scale, vegetated prototype. This time we wanted to carefully observe how much wave refraction, turbulence, and drag effects would be caused by varying densities and roughnesses of vegetation.
This wave tank facility has many of the same data collection systems as the larger tank, and in this case were able to focus them all directly around a single floating marsh prototype, rather than across a larger network. We used an Acoustic Doppler Current Profiler (ADCP), which records water velocity and vector direction vertically through the water column, giving us a cross-sectional view of the hydrodynamic effects. We also set up wave gauges on either end of the tank, (i.e. seaward and shoreward of the prototype) to measure how the wave characteristics were altered by the presence of the prototype. The data we collected using these instruments helped us visualize what happens with the dispersed wave energy and, therefore, how much an individual unit can affect and increase that dispersion.

Set Up

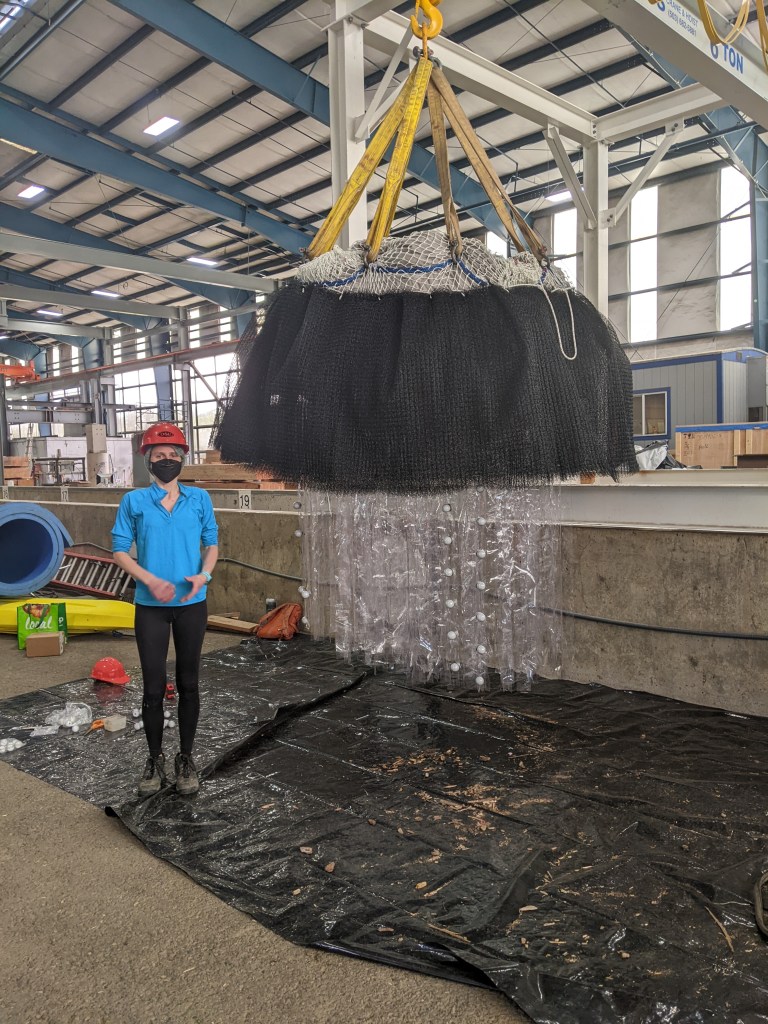
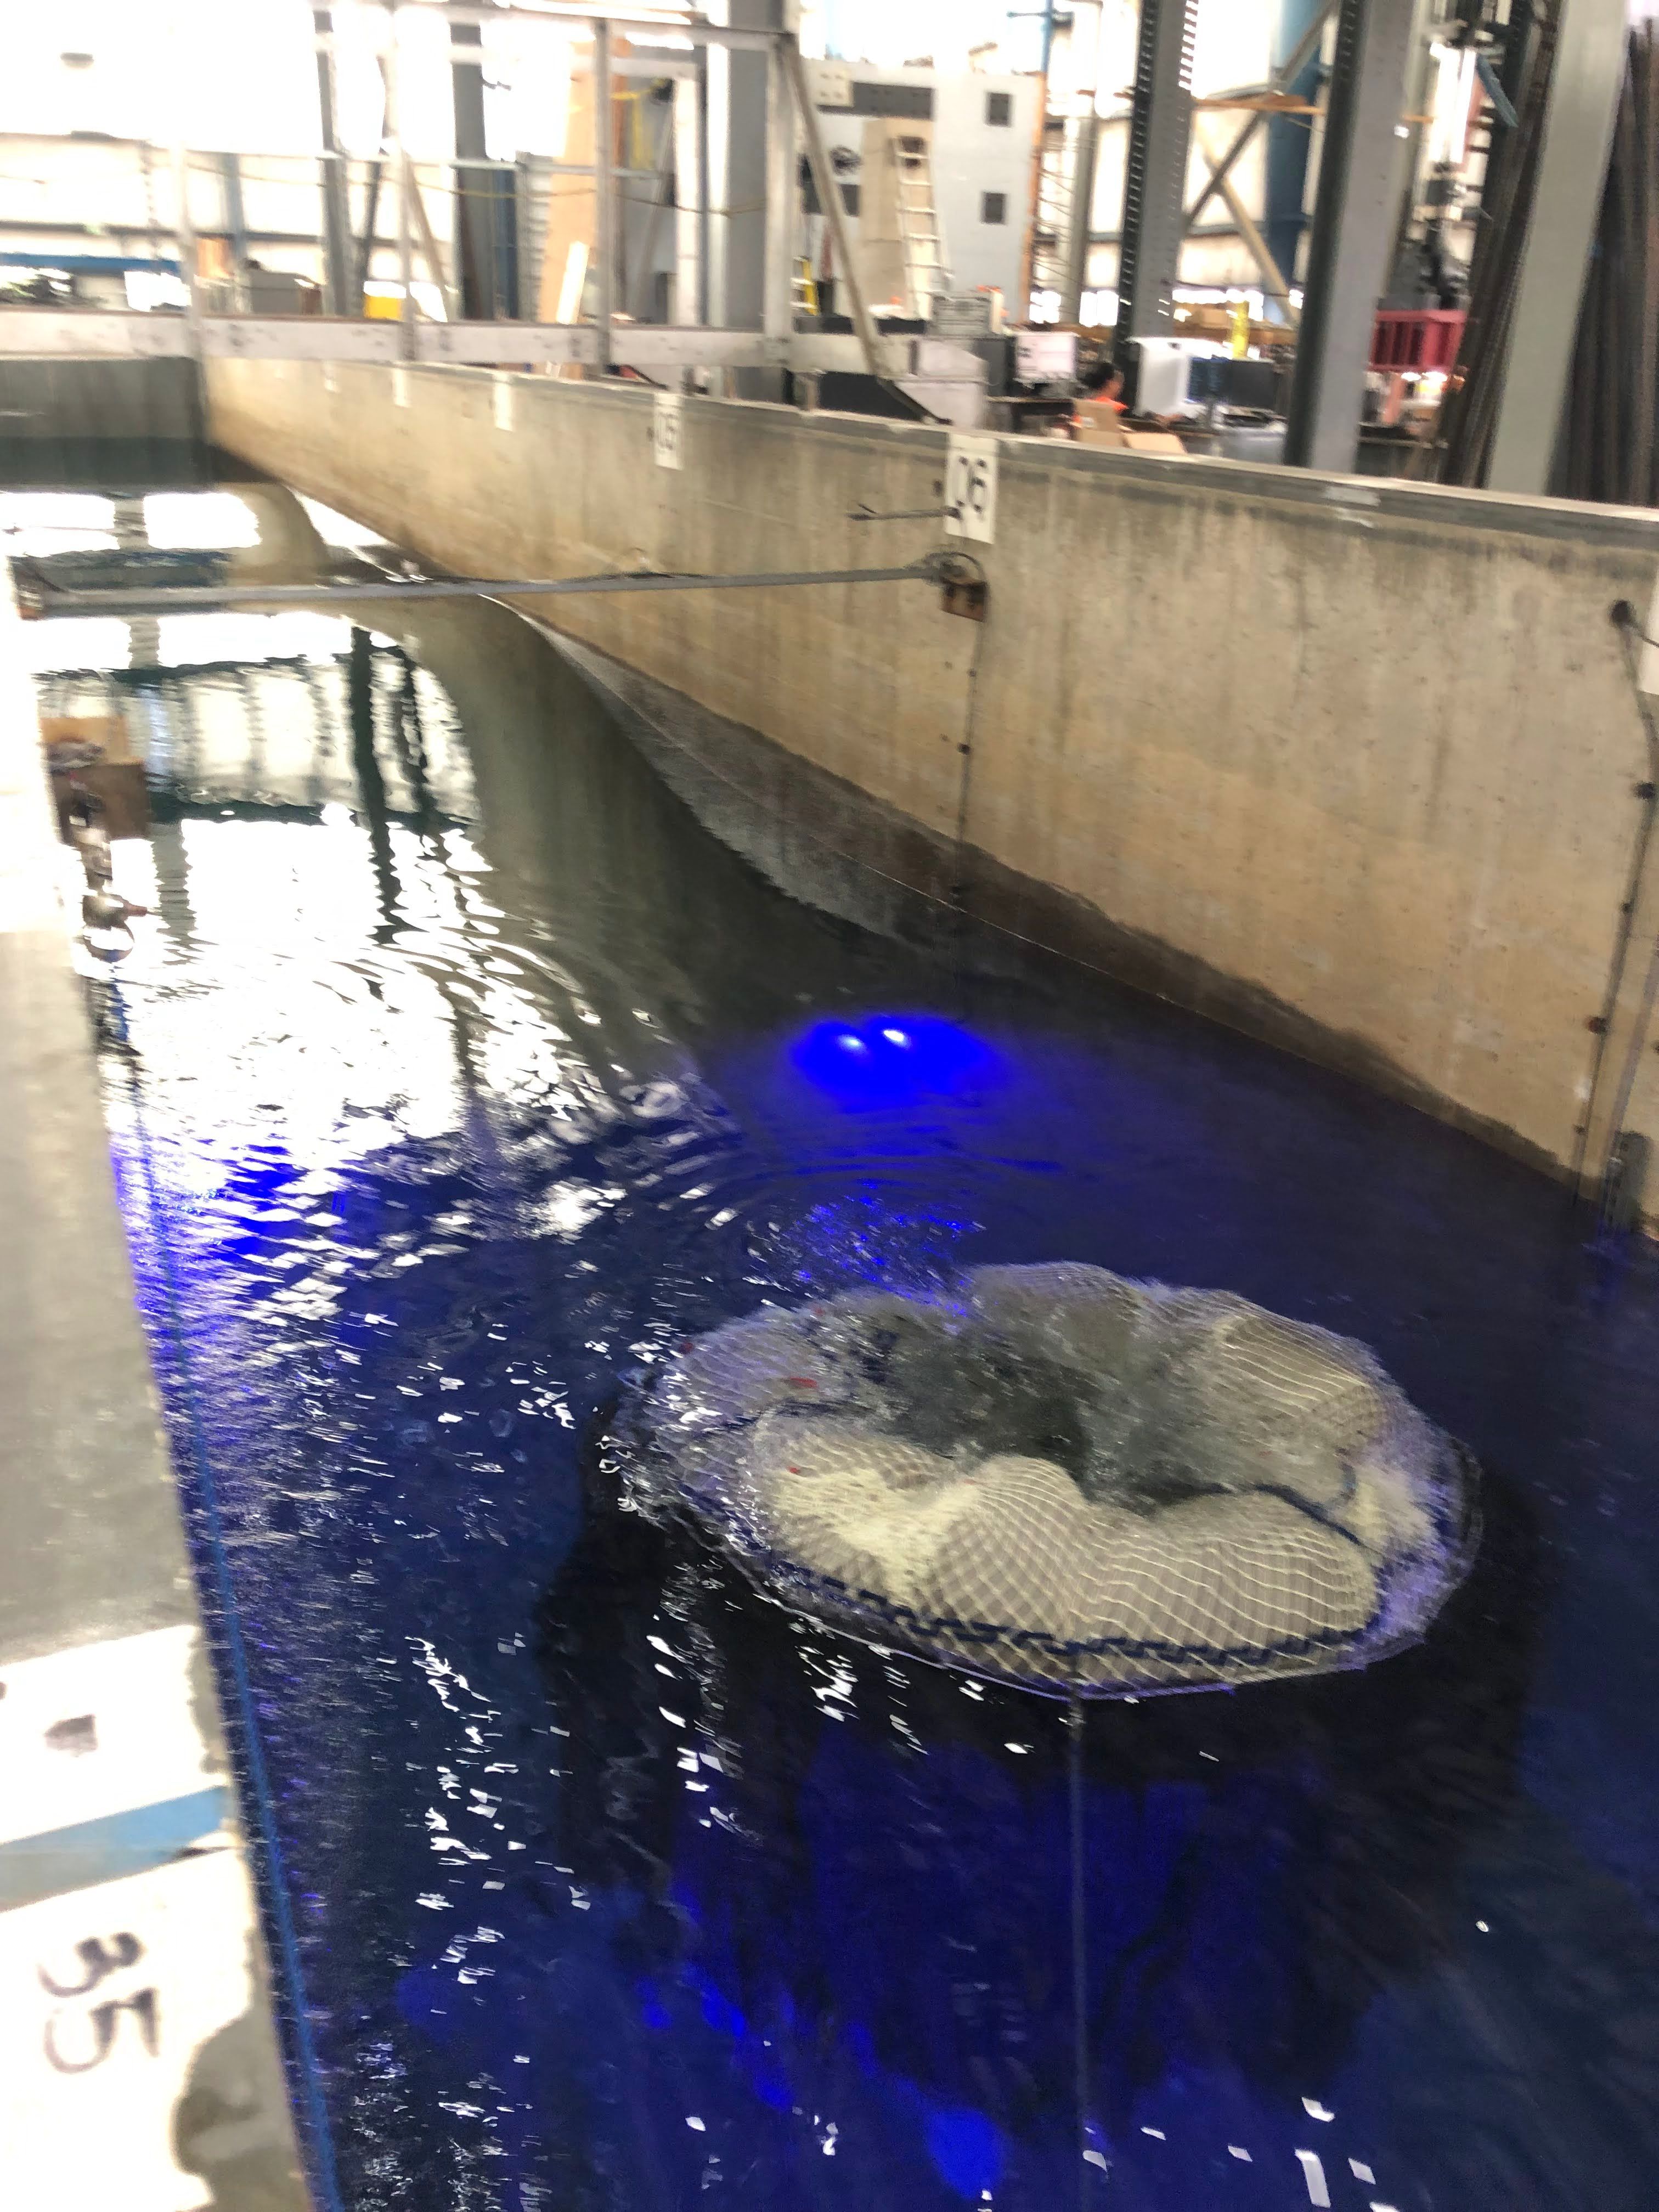
To prepare for this experiment, we built one floating prototype, most similar to the Pouch Net Prototype (variety, using canvas, foam, and wood waste. We also attached rainscreen mesh and thick flexible vinyl sheets to hang from the bottom of the prototype to mimic vegetation and seaweeds.
This single unit was hoisted into the wave tank, positioned 100 feet from the wavemaker, approximately one third of the way from the “ocean” end of the tank, and connected to force gauges attached to the tank walls. We ran various experimental trials, adjusting the wave period, wave height, unit draft, and the density of vegetation. We altered the unit’s draft, or the amount of the prototype below the waterline, by adding weights onto it. During these trials we varied the wave period from 2 to 3 seconds in 0.2 second increments, and the wave height from 0.2m to 0.35m in 0.5m increments.
We also tried a novel data-gathering technique in development by one of our teammates Tyler McCormack. Tyler’s method uses video imagery of the water’s surface (from a cheap, consumer-grade camera) to map the complex hydrodynamics beneath the surface.


Results
The magnitudes of wave-averaged velocity throughout the water column onshore of the floating prototype decreased in the presence of the non-vegetated floating prototype, and decreased even further when vegetation was added. These results were robust in the case of waves with a 2 second period. When the wave period was increased to 3 seconds, the reduction in velocity was visible, but less pronounced.
The velocity reduction onshore of the prototype was most pronounced in the case of 0.3 meter waves. The taller the wave, the steeper it is, and we expected steeper waves to collapse when encountering the prototype. Therefore, we expected the prototype to have the lowest impact in the case of 0.2 meter waves and the highest with 0.35 meter waves, which was not exactly the case. This suggests that there are other factors, such as turbulence and reflection, that are in play. Further analysis is required to pin these down more carefully.
The scope of the analysis focused mainly on determining if the prototype is most effective at damping shorter wavelength, higher frequency waves. We determined that this in fact is the case. A separate analysis, using the wave gauge data, shows that this experiment agrees with the previous network-scale experiment, but we uncovered some more complex dynamics around the individual unit.

