Research Magnitudes And Methodologies
To develop a complete understanding of our research, we rely on understanding the integrated relationships at all scales: from microorganisms to ecological cycles of gas and nutrient exchange.
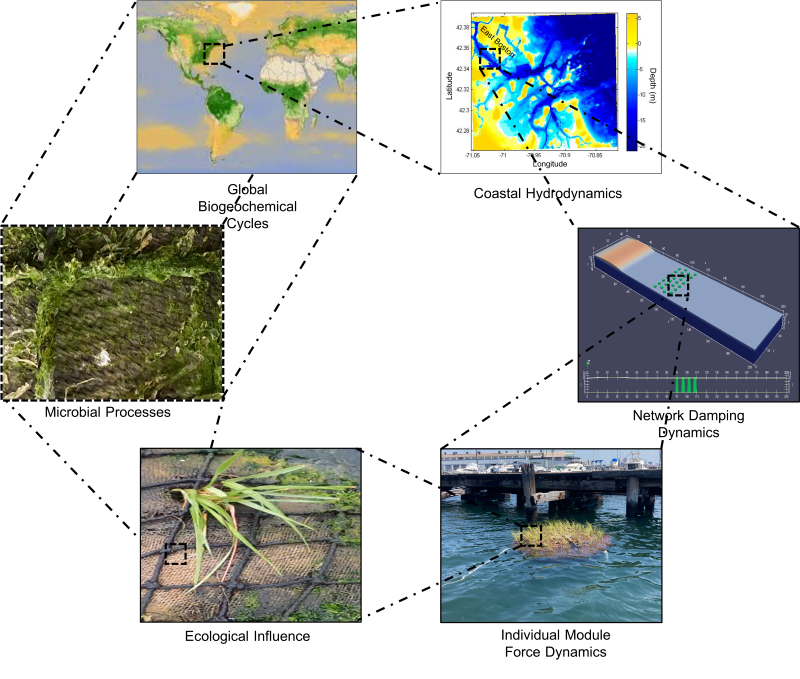
On a coastal scale, the Emerald Tutu functions as a component regulating coastal hydrodynamics. Understanding the impacts on erosion, sediment transport and flooding is crucial to developing the desired behavior of the Emerald Tutu.
Studying at the scale of an Emerald Tutu network provides a window into the specific properties of the floating marsh mat network and how they function to influence the wave energy and turbulence of incoming waves.
Narrowing into the scale of an individual module allows for the research of turbulence dynamics and structural integrity. This scale shows how the units influence each other and how those forces affect component and material properties.
Within and around each individual module exists an ecosystem of planted and volunteered species, all of which have their own unique relationship with the Emerald Tutu units. Interpreting these relationships and reactions is crucial to improving damaged habitats and understanding ecosystem services.
At the microscopic level, the microorganisms found throughout an Emerald Tutu network are the ultimate key players. Their processes influence not only the ecosystem they exist in but also play a crucial role in the global chemical cycles we all depend on to survive.
The Emerald Tutu functions on a global scale through interactions with important chemical cycles such as carbon and nitrogen. As a part of these cycles, the Emerald Tutu has the potential to play a role in carbon sequestration and nutrient remediation.
Surface Wave Damping Simulations
This surface wave-resolving numerical model is simulating the performance of a network of frictional mass units in a channeled wave-tank environment. This model was one of our earliest methods for physical simulation; subsequent physical prototyping and wave tank experiments have allowed us to compare the model behavior with a variety of laboratory-observed conditions and tune its accuracy. In other words, the physical dynamics shown here are true to the way an eight-row network of actual marine biomass units would affect regular waves of 2-foot height and 6-foot wavelength—the wave formation would diffract as shown, and overall wave energy would be reduced by over 70%. By adjusting the input parameters of the simulation, such as wavelength and network configuration, the model is able to calculate corresponding conditions of the resultant wave behavior as it reacts to the different configurations. This allows for the optimization of the size and configuration of an Emerald Tutu project based on the environmental conditions of a particular site
What We Learned
In creating this model and observing how the simulated waves interact with a simulated unit network, we were able to generalize the reactive properties of the marsh mat network that produce the wave dampening effect. Through validation from the Wave Tank Lab Tests, we confirmed that with enough rows, an Emerald Tutu network can progressively dampen any wave. We also found that the unit spacing affects damping properties, with tighter networks more effective at damping incoming waves. Diversifying the size of the mats also improved damping efficacy, but was not as impactful as the network spacing. Try the interactive Data Viewer GUI to see how these factors affect performance in varying wave conditions.
Numerical-Physical Model Verification
To create a mathematical representation of the floating unit network in this simulation environment, we first guessed at physical fluid properties (increased density, viscosity, and drag constants) that we thought would represent our vegetated mat network. Then, after our 44-unit prototype network was built in the wave lab in Summer 2021, we were able to reverse-engineer more accurate physical fluid properties from observed physical performance in the lab. To put our assumptions and numerical representation techniques to the test, we used our research from the wave tank experiments conducted at the O.H. Hinsdale Wave Tank Research Facility to verify results through our many trials with different network configurations and wave types. Proving that our numerical model can accurately reproduce the observed network behavior in any wave condition is a critical step in confidently showing the efficacy of a given network in situ.
Shallow Water Modeling Engine
This model was developed using standard fluid surface-resolving mathematics (Navier-Stokes shallow water equations, Boussinesq approximations, a no-slip lateral boundary, and a finite-difference scheme) and was run on a supercomputer. These standard equations are applicable to many different scenarios including atmospheric flow, coastal dynamics, and river and channel flow.
Definitions
Finite-Difference Scheme
+This describes the method for how the solver computes the numerical equations. In this method, derivatives are written in terms of discrete quantities of dependent and independent variables. Compared to other methods of computation, such as spectral and pseudospectral, the finite difference method is more complex and less accurate; however, it is also more flexible and able to handle varying coefficients, differing boundary conditions and irregular geometries making it more suitable for the variability and irregularity of coastal shorelines.
No-Slip Lateral Boundary
+This describes the boundary condition at which the fluid interacts with its surrounding layer. The no-slip condition assumes that the speed of the fluid layer in direct contact with the boundary layer is identical to the velocity of the boundary layer. The simulated box boundaries therefore do not have any edge or channeling effects.
Boussinesq Approximations
+The Boussinesq approximations assume that variations in fluid density are so small that they have no effect on the flow field except to provide buoyancy forces. This assumption allows for the elimination of the vertical variable from flow equations while still maintaining influences of the vertical structure. In doing so, the model is now able to incorporate dispersion effects which better represent wave propagation.
Navier-Stokes Shallow Water Equations
+The Navier-Stokes equations are cornerstone equations in fluid dynamics which represent Newton’s Conservation of Momentum and Conservation of Mass laws for Newtonian fluids (fluids, like water and honey, that have constant viscosity at a constant temperature). Integrating these partial differential equations in a shallow-water context removes the vertical velocity (z-direction) term due to the assumption that the scale of the vertical velocity is small compared to the horizontal velocity scale. In this case, w
Drag
+While drag also represents friction experienced by a fluid, unlike viscosity, it is the external friction generated by the interaction of a fluid with a solid surface or fluid of differing density. Viscosity is a property of the fluid, while drag is a function of the fluid velocity (relative to the object or surface) and cross sectional area of interaction.
Viscosity
+In fluid dynamics, viscosity represents the internal friction a fluid experiences as it flows through a boundary. It is a property of the fluid and is often encapsulated by a single constant value. The higher the viscosity constant, the more resistant it is to flow.
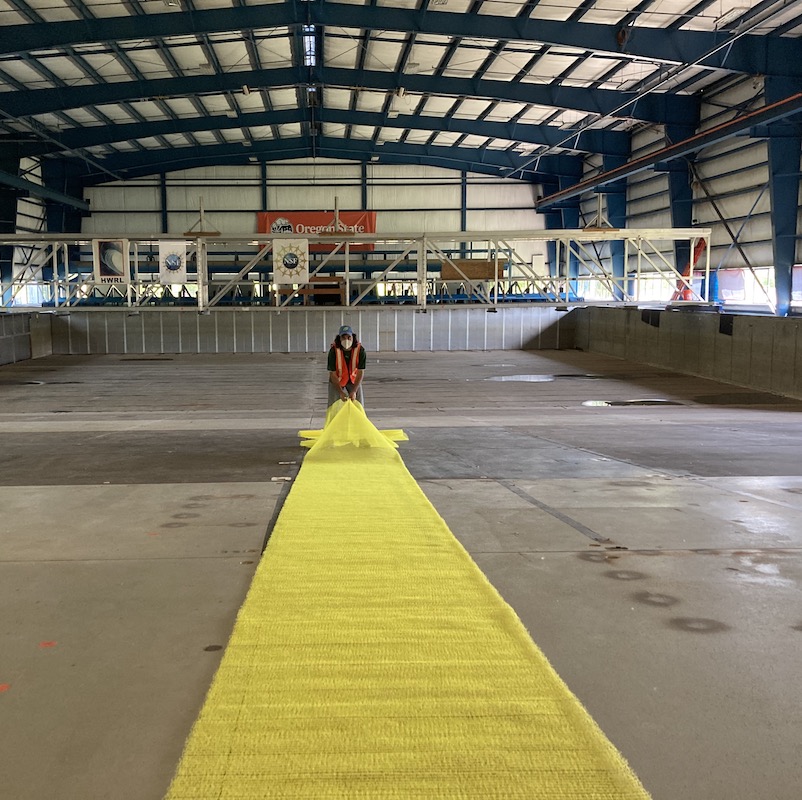
Network Wave Lab Testing
The wave maker device creates controlled waves of predetermined wavelength, height and period.
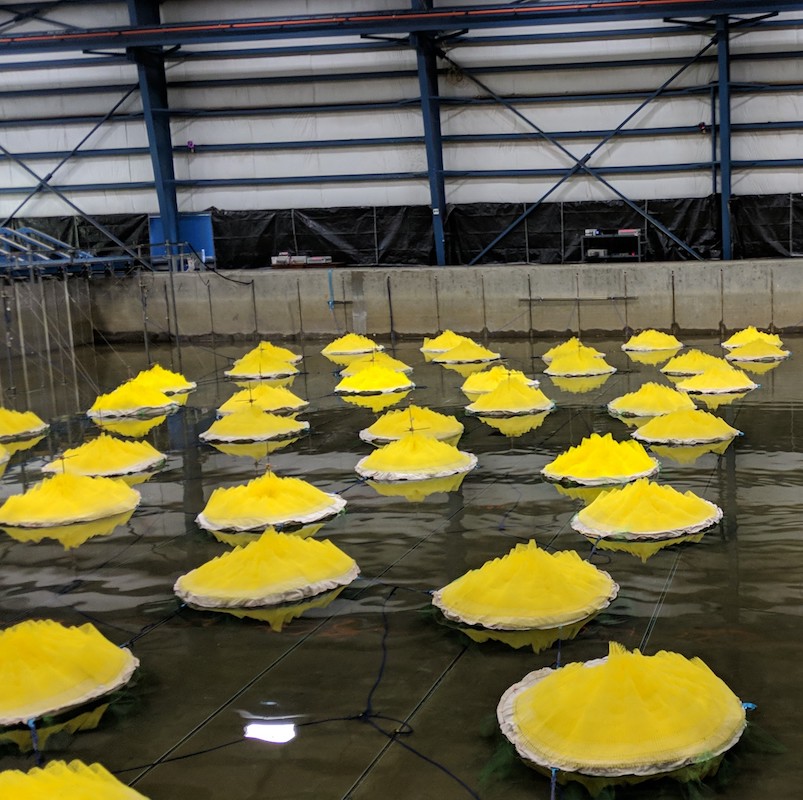
A half-scale Emerald Tutu network composed of representative materials was used for this laboratory testing. The green mesh-like fabric shown here represents marsh vegetation.
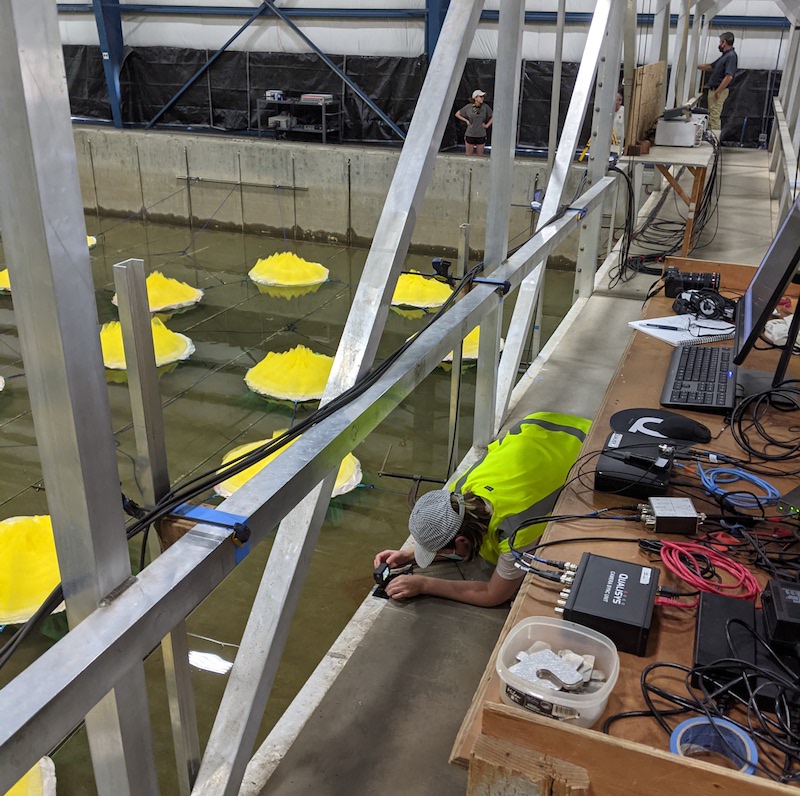
The instrumentation bridge monitors several different water properties including velocity and surface depth after the waves have passed through the Emerald Tutu network.
As the waves move towards the “shore,” a visible difference can be observed in the wave behavior after passing through the network.
Critical to the development of our research was the ability to determine how well the network performs its primary function in a controlled laboratory environment. To do this we traveled to the O.H. Hinsdale Wave Research Facility at Oregon State University in the Summer of 2021. Like a waterpark wave pool, the wave tank research facility is a large water-filled basin that produces controlled waves. However, instead of screaming children and flying pool noodles, this wave tank is equipped with data collection devices to monitor statistics such as wave height, water pressure, water velocity, and tension force. It’s also equipped with optical sensors which provide a precise visual record of unit movements in three dimensions.
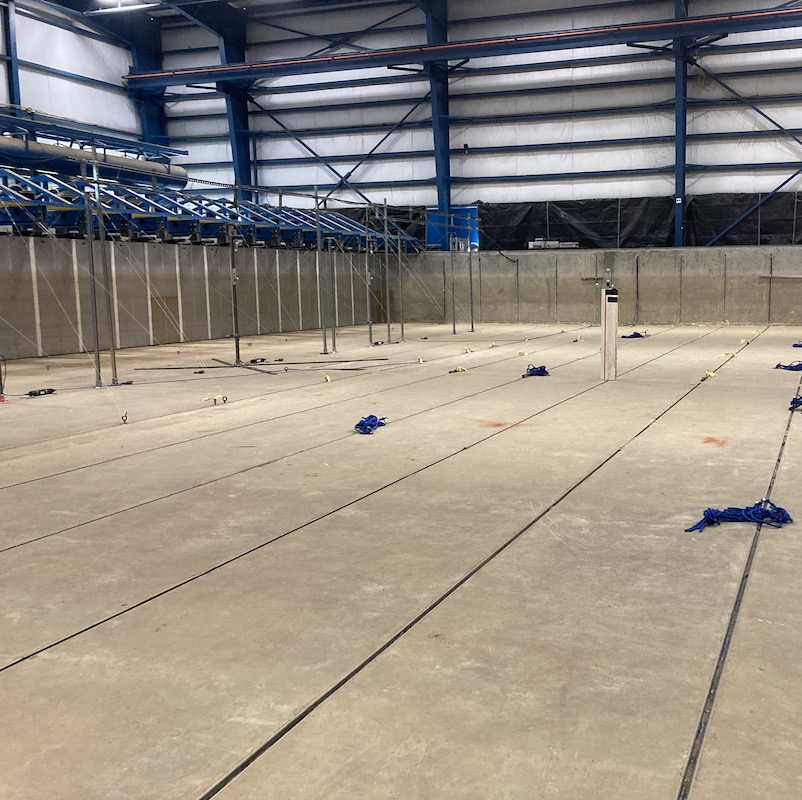
Set Up
To execute this experiment, we constructed 44 half-scale prototypes with representative materials such as tulle fabric and rainscreen to represent emergent vegetation and seaweed. We ran 32 different experimental test trials varying the wave period, wave height and network configuration to generate thorough results. We equipped the wave tank with Acoustic Doppler Velocimeter, wave gauges, infrared cameras and force sensors to collect the desired data.
What We Learned
With over a month spent constructing, testing, and rearranging the prototype networks, we collected terabytes of data. Initial results proved the effectiveness of our design by demonstrating that small, short waves can be reduced by up to 90% of their original height. The tests also confirmed our hypothesis that the wave attenuation capacity is a function of the network configuration and initial (incoming) wavelength. The collected data showed that when waves were smaller than the size of the mats, the network was highly effective at wave dampening. This effectiveness decreased with an increase in wavelength, but did not drop to zero until wavelengths were approximately 8 meters, or the aggregate size of all 4 rows. These results have been significant to our team and provided a crucial step in our continued research. Of course, we must remember this is a controlled laboratory experiment that comes with its own opportunities and constraints. While the wave generator allowed us to test very specific conditions, the boundaries of the wave tank created results that would not be experienced in an unconstrained coastal environment. Using our numerical model and control tests, we are working towards removing reflections in the data to remove these impacts and refine our model. See the full results published in Frontiers Built Environment, “The Emerald Tutu: Floating Vegetated Canopies for Coastal Wave Attenuation”
Definitions & Instruments
Wavelength
+Wavelength is the distance from the crest of one wave to the crest of the consecutive wave. It is determined by the velocity of the wave times the wave period. Our experiments included varied wavelengths from 1 meters to 10 meters.
Wave Attenuation Capacity
+Wave attenuation capacity refers to the ability of the network to reduce the height and energy of a wave.
Force Sensors
+Force sensors attached to the anchors measure and report the load imposed on the anchors by the tension of the floating mat modules.
Infrared Cameras
+Infrared cameras installed on the instrumentation bridge beam out and receive light waves which are reflected by tracking devices mounted on each floating mat module. This allows for direct motion tracking of the mats in three-dimensions.
Wave Gauges
+Wave gauges use pressure sensors to measure and report water surface height as it changes with the height of a passing wave. Bottom-mounted gauges continuously monitor the pressure from the water above them, converting that value to a wave height prof
Acoustic Doppler Velocimeter (ADV)
+An ADV is an instrument used to measure water velocity in three dimensions of a water column. Using properties of sound waves, it measures the difference between emitted and received frequencies to calculate the relative velocity of the water.
Network Configuration
+Network configuration refers to the spacing and density of the mats relative to each other. Our experiments included a sparse configuration where the mats were spaced far apart and a dense configuration with less spacing between the mats. Additionally, we included tests of the dense configuration in which we simulated a higher concentration of submerged vegetation.
Wave Period
+Wave period is the time it takes for one full wave to pass a specific point. It is the inverse of wave frequency so a higher wave period means the waves have low frequency. Our experiments included a range of wave periods from 1 second to 6 seconds.
Wave Height
+Wave height, also known as amplitude, is the height of the wave from the equilibrium position to the maximum distance traveled. The distance from the lowest point of a wave to the height is 2x the amplitude. Our experiments included a range of wave heights from 10 cm to 45 cm.
Prototype V0.01 Field Testing
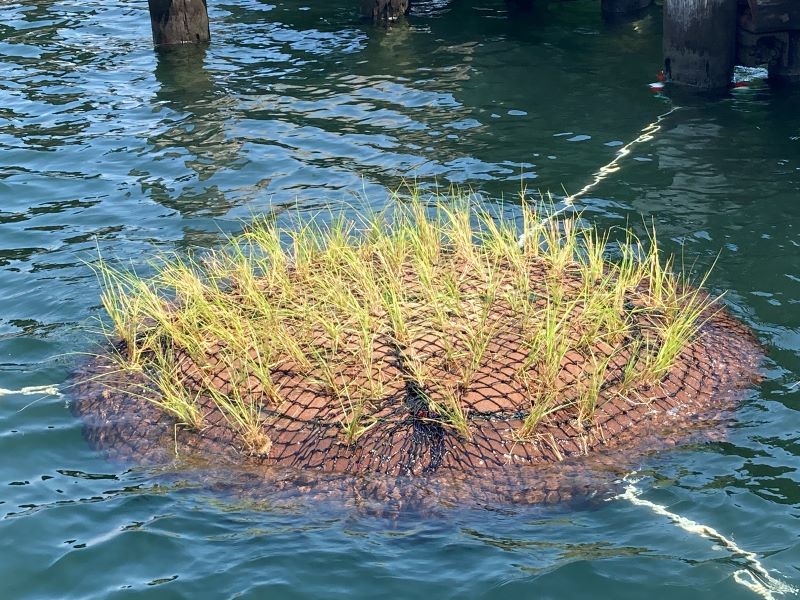
Fully constructed prototype module planted with 100 marsh grass plugs
Tether connections using buoyed chain rings to wrap around the circumference of the pier pylon in order to rise and fall with the tides.
Tension loop rope connects the inner substrate material to the tethering connections
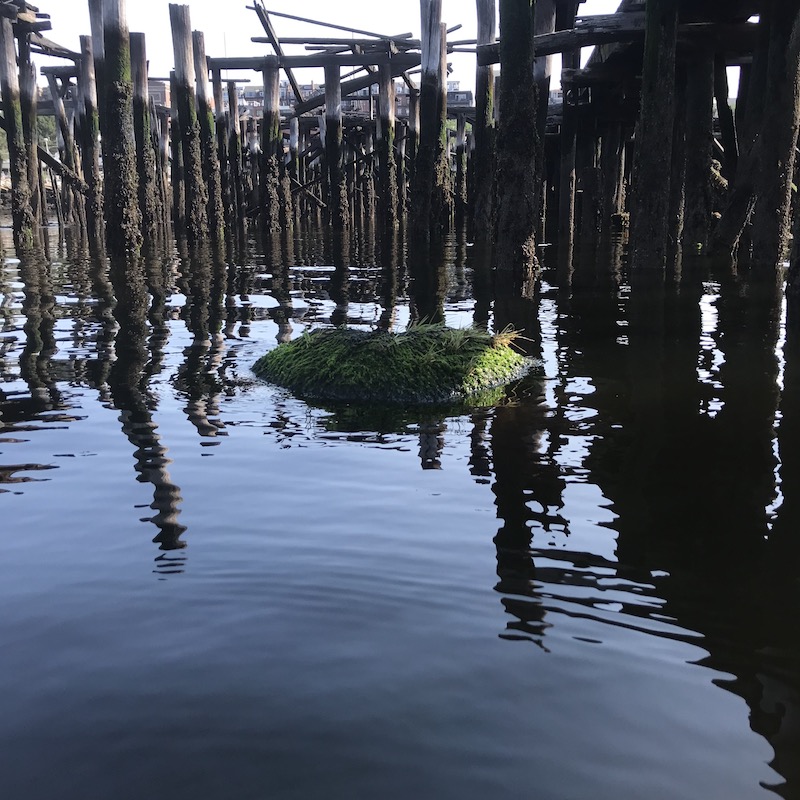
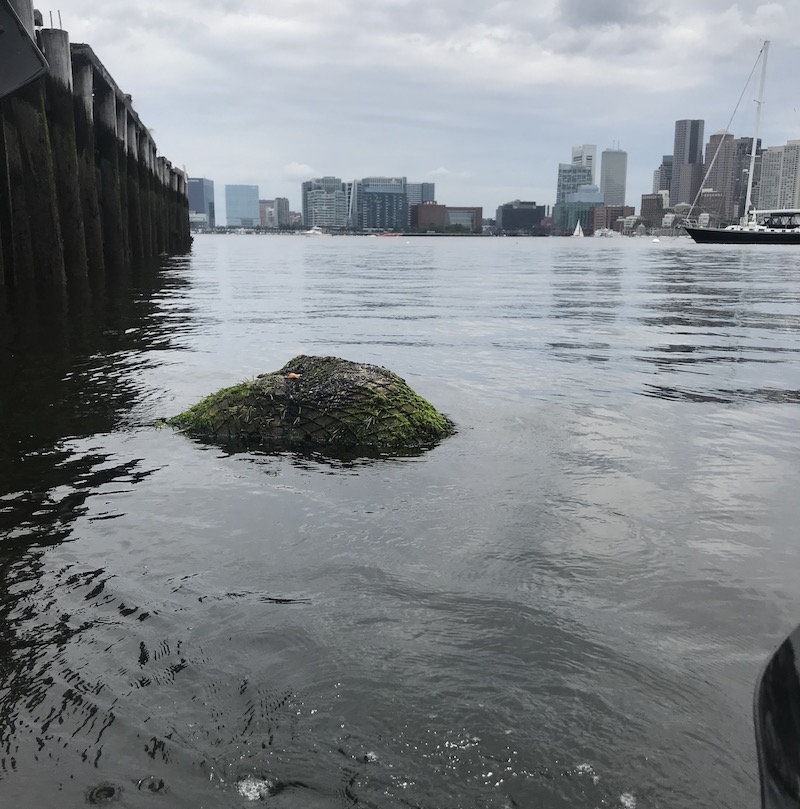
Site location adjacent to the East Boston Shipyard and Marina provided a controlled environment that was exposed to direct outer-Boston Harbor wave fetch. The abandoned pier location meant that the prototype was out of the way of delicate ecosystems and commercial activity.
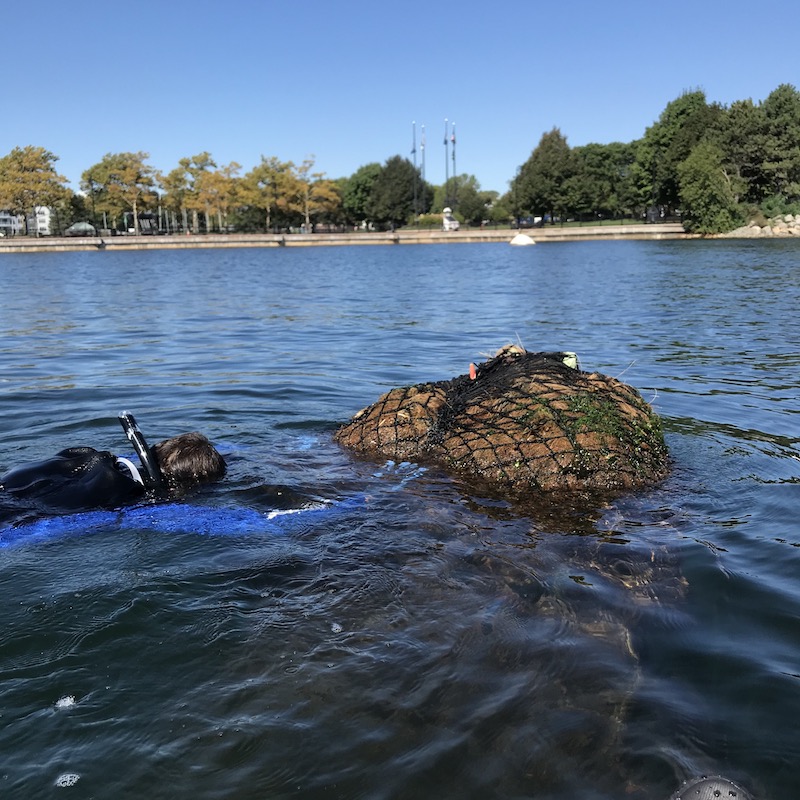
We installed our first full-scale prototype in East Boston Harbor in May 2021, leaving it in the water until the end of October. For this prototype test, we intended to assess the durability of the materials, the integrity of the unit design, and the health of the planted and volunteered ecology.
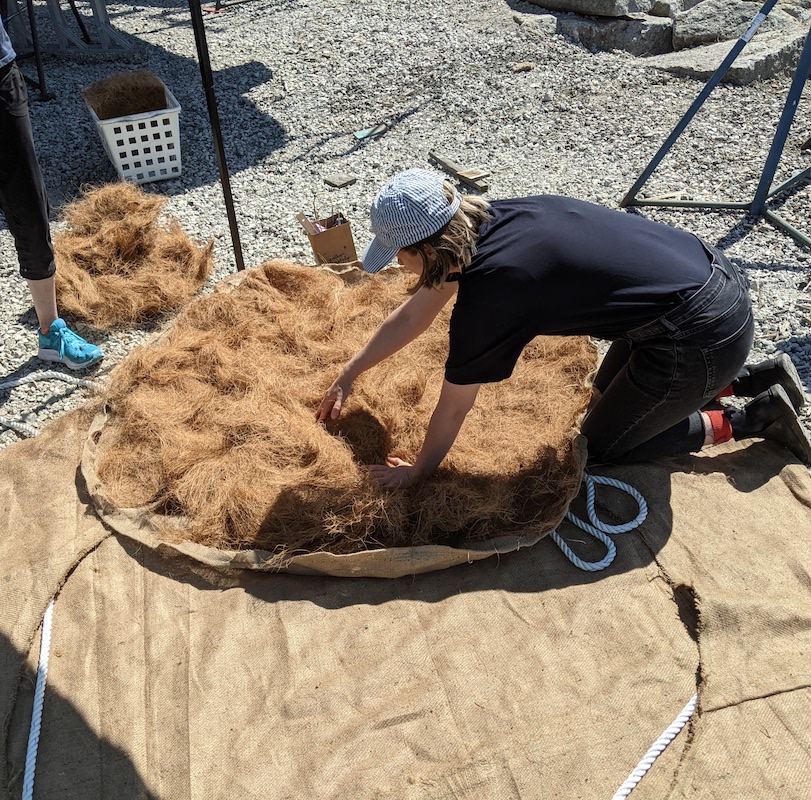
Installation
With sewing needles, burlap and a large pile of woodchips in hand, we began the dirty work of installing a massive mat of biomass amidst the abandoned piers of East Boston. It was hard work and a great demonstration of the need to manage the site and natural exigencies; however, through working with the tides and weather, we had our first full-scale prototype afloat and installed!
Monitoring
Over the course of the summer and fall, we made several trips to monitor the state and changes of the prototype:
T=6 weeks (mid July): Approximately 6 weeks after installation, we observed significant growth of the planted marsh grass and substantial colonization by aquatic organisms. It was also clear that the shape of the mat had deformed, becoming more elongated and reducing the surface area above the water line.
T=9 weeks (early August): Several weeks later, we noted that while the marsh grass was still growing, it appeared it had been grazed and therefore was much less abundant. Evidence of bird visitation in the form of severed shoots and digested shells was observed. The shape of the mat appeared to be the same and the materials were still intact.
T=12 weeks (late August): After a few more weeks, the remaining marsh grass organisms appeared to experience significant regrowth and were much taller than the last visit. For this visit, we acquired a GoPro camera to document the status of the mat below the water line. The videos were spectacular and allowed us to start identifying several of the submerged species

T=16 weeks (early October): During this visit, we observed that the mat was nearly entirely submerged and much of the organism growth had slowed. While there was still sea lettuce growth near the top of the mat, the marsh grass was below water and had experienced significant stress.